
SPSS Data Analysis Services for Research, Thesis and Dissertation Projects
By Paperza Editorial Team
|
19 Oct 2026
|
11 min read
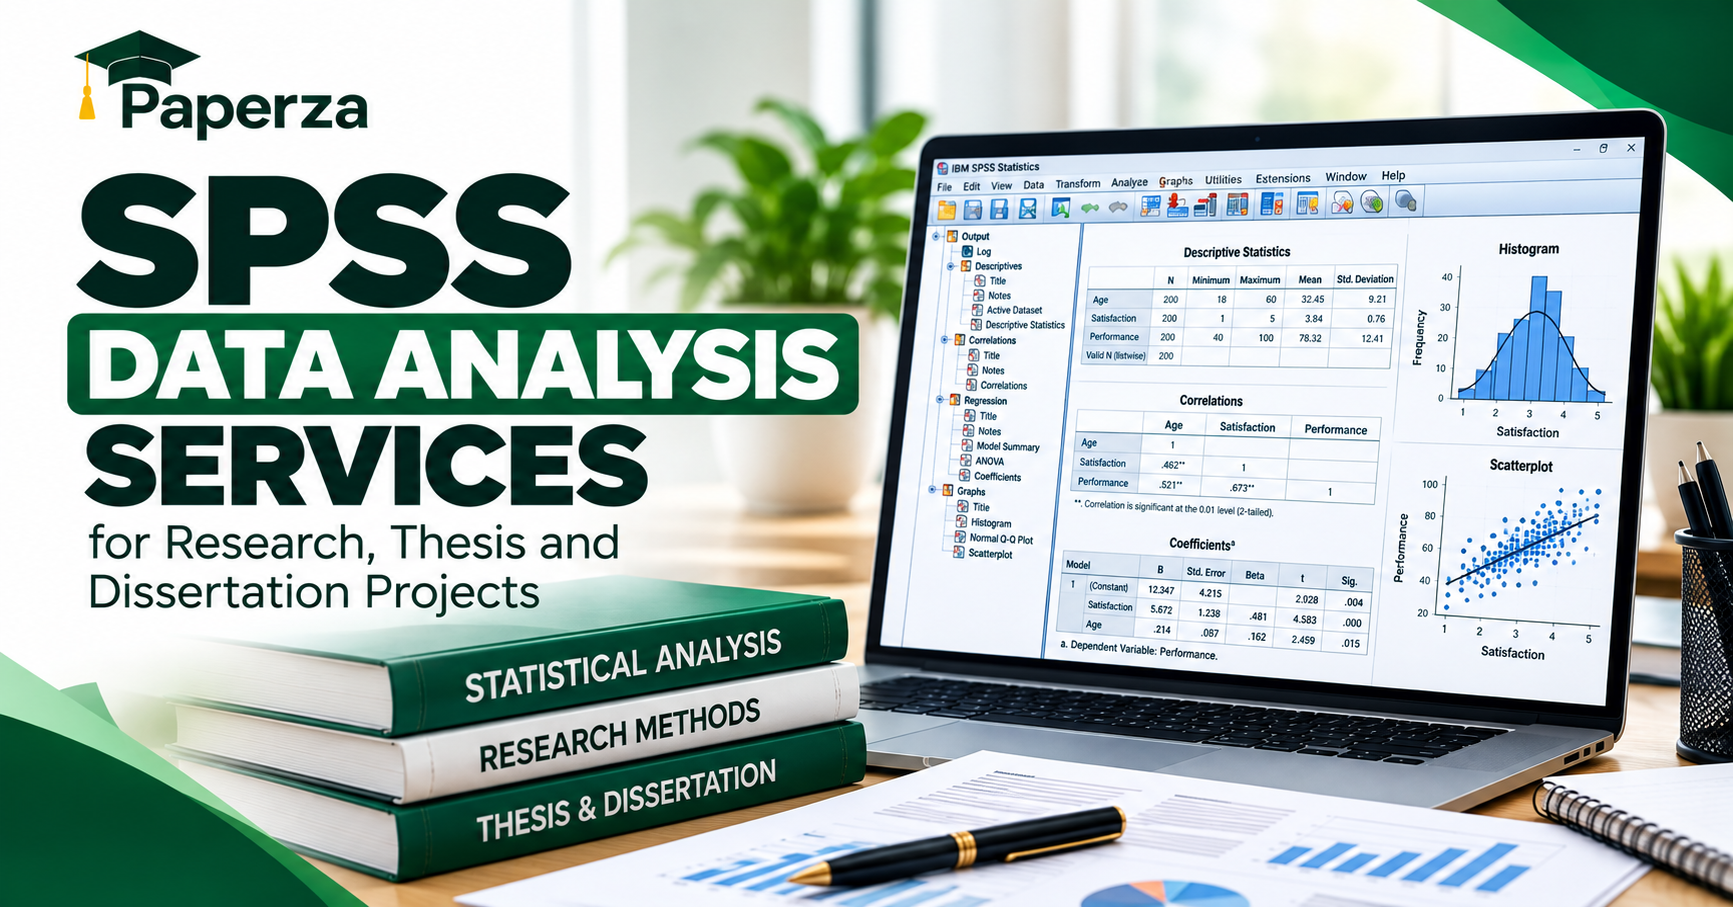
SPSS Data Analysis Services for Research, Thesis and Dissertation Projects
Are you looking for professional SPSS data analysis services for your research project, master's thesis, PhD dissertation, or journal publication?
Analyzing research data can be challenging, especially when you need to select appropriate statistical tests, clean datasets, interpret results, and present findings according to academic standards.
Whether you are working with survey responses, experimental data, questionnaires, or quantitative research datasets, accurate statistical analysis is essential for producing reliable research findings.
At Paperza, we provide professional research data analysis services using SPSS, Excel, Python, and R. Our services support postgraduate students, PhD candidates, academic researchers, healthcare professionals, and organizations that require accurate statistical analysis and clear interpretation of results.
From descriptive statistics and hypothesis testing to regression analysis, data visualization, and statistical reporting, we help researchers understand their data and present meaningful findings.
What Are SPSS Data Analysis Services?
SPSS data analysis services involve using IBM SPSS Statistics to organize, clean, analyze, and interpret quantitative research data.
SPSS is widely used in academic research because it supports various statistical methods and provides tools for analyzing survey responses, experimental results, and other structured datasets.
Professional SPSS data analysis assistance may include:
- Data entry and cleaning.
- Data coding and variable preparation.
- Descriptive statistical analysis.
- Hypothesis testing.
- Correlation analysis.
- Linear and logistic regression.
- T-tests and analysis of variance (ANOVA).
- Chi-square tests.
- Reliability analysis.
- Exploratory factor analysis.
- Statistical tables and charts.
- Interpretation of statistical results.
- Research findings and results reporting.
The appropriate analysis depends on your research questions, hypotheses, study design, and available data.
If you already have a dataset and need professional statistical support, explore Paperza's research data analysis services.
Who Needs Professional SPSS Data Analysis Services?
Statistical analysis is required across numerous academic and professional disciplines.
1. Master's Students
Master's students frequently need statistical analysis for dissertations, research projects, and survey-based studies.
Common requirements include descriptive statistics, hypothesis testing, questionnaire analysis, and interpretation of research findings.
2. PhD and Doctoral Researchers
Doctoral research may involve complex datasets, multiple variables, regression models, experimental designs, and advanced statistical methods.
Professional data analysis support can help doctoral researchers select appropriate techniques, verify statistical assumptions, and understand their results.
3. Academic Researchers
Researchers preparing journal manuscripts may need statistical analysis, publication-ready tables, data visualizations, and clearly explained statistical findings.
4. Healthcare and Medical Researchers
SPSS is commonly used to analyze clinical data, patient surveys, public health datasets, and healthcare research outcomes.
Depending on the research design, statistical methods may include logistic regression, group comparisons, and correlation analysis.
5. Business and Social Science Researchers
Researchers in business administration, economics, marketing, education, psychology, sociology, and management frequently use SPSS to analyze questionnaires and investigate relationships between variables.
Our Professional SPSS Data Analysis Services
Paperza provides statistical analysis support across different stages of quantitative research.
1. Data Cleaning and Preparation
Before conducting statistical analysis, datasets must be checked for errors, missing values, duplicates, inconsistent entries, and incorrect variable formats.
Our data preparation services include:
- Identifying missing values.
- Checking duplicate records.
- Reviewing inconsistent responses.
- Coding categorical variables.
- Preparing questionnaire responses.
- Identifying potential outliers.
- Organizing variables.
- Preparing datasets for statistical analysis.
Data cleaning decisions should be documented and justified to avoid unintentionally changing the meaning of the research data.
2. Descriptive Statistical Analysis
Descriptive statistics summarize the main characteristics of a dataset.
Common descriptive statistics include:
- Mean.
- Median.
- Mode.
- Standard deviation.
- Variance.
- Minimum and maximum values.
- Frequencies.
- Percentages.
For example, a researcher investigating student satisfaction may use descriptive statistics to summarize questionnaire responses and participant characteristics.
We help researchers generate statistical tables and interpret descriptive results accurately.
3. Hypothesis Testing
Hypothesis testing helps researchers evaluate whether the observed data provide evidence against a specified null hypothesis.
Depending on the research question and assumptions, common statistical tests include:
- Independent-samples t-test.
- Paired-samples t-test.
- One-way ANOVA.
- Repeated-measures ANOVA.
- Chi-square test.
- Mann–Whitney U test.
- Wilcoxon signed-rank test.
- Kruskal–Wallis test.
We assist researchers in selecting appropriate statistical tests and interpreting the resulting statistics, confidence intervals, and p-values.
4. Correlation Analysis
Correlation analysis examines the direction and strength of relationships between variables.
Common approaches include Pearson correlation and Spearman rank correlation.
For example, a researcher may investigate whether study hours are associated with academic performance.
Correlation analysis can help identify statistical relationships, but correlation alone does not establish causation.
5. Regression Analysis
Regression analysis examines relationships between an outcome variable and one or more predictor variables.
Our regression analysis support includes:
- Simple linear regression.
- Multiple linear regression.
- Binary logistic regression.
- Model diagnostics.
- Coefficient interpretation.
- Statistical significance assessment.
- Confidence interval reporting.
For example, a business researcher may use multiple regression to investigate whether customer satisfaction, service quality, and pricing are associated with customer loyalty.
We help researchers evaluate model assumptions and explain results in relation to their research objectives.
6. Reliability Analysis
Reliability analysis is frequently required for questionnaire-based research.
Cronbach's alpha is one commonly used measure of internal consistency.
We assist with reliability testing and interpretation, including identifying potential problems with questionnaire items.
Reliability coefficients should be interpreted in context rather than judged using one universal threshold.
7. Factor Analysis
Factor analysis is used to investigate underlying relationships among observed variables.
Exploratory factor analysis may help researchers identify latent constructs within questionnaire data.
Depending on the research requirements, we assist with data suitability checks, factor extraction, rotation, and interpretation.
8. Statistical Tables and Data Visualization
Presenting statistical results clearly is essential for academic research.
We help prepare:
- Frequency tables.
- Descriptive statistics tables.
- Correlation matrices.
- Regression tables.
- Bar charts.
- Histograms.
- Scatter plots.
- Box plots.
- Line charts.
Charts and tables can be formatted to match applicable university or journal requirements.
Thesis and Dissertation Data Analysis Services
Many postgraduate researchers complete their data collection but experience difficulty analyzing and interpreting the results.
A typical quantitative thesis or dissertation may require a results chapter containing participant characteristics, descriptive statistics, hypothesis testing, and interpretation.
At Paperza, we provide statistical assistance for thesis and dissertation projects.
Research Data Preparation
We help organize datasets collected through questionnaires, surveys, experiments, or other quantitative methods.
Statistical Test Selection
We assist researchers in identifying statistical techniques appropriate to their hypotheses, variables, and study designs.
Statistical Analysis
We perform agreed statistical procedures and provide relevant output files.
Results Interpretation
We explain what the statistical findings indicate, including effect estimates, uncertainty, and limitations.
Results Tables and Figures
We prepare clear statistical tables and visualizations suitable for academic reporting.
Research Results Reporting Support
We help researchers understand and accurately describe their statistical findings while maintaining their responsibility for the final academic submission.
Need help analyzing your thesis or dissertation data? Visit Paperza's statistical analysis and academic research support services to discuss your dataset and research requirements.
SPSS vs Excel vs Python vs R: Which Is Best for Research Data Analysis?
Different statistical software applications offer different capabilities.
| Software | Best suited for |
| SPSS | Survey analysis, hypothesis testing, regression, academic statistical research |
| Excel | Data organization, descriptive statistics, basic analysis, charts |
| Python | Data cleaning, automation, statistical modeling, large-scale data processing |
| R | Statistical modeling, advanced analysis, reproducible research, visualization |
SPSS Data Analysis
SPSS is particularly useful for researchers working with structured quantitative datasets.
Its graphical interface makes many common statistical procedures accessible.
Excel Data Analysis
Microsoft Excel is useful for organizing datasets, calculating summary statistics, and producing basic visualizations.
However, complex statistical research may require specialized software.
Python Data Analysis
Python supports data cleaning, statistical analysis, automation, and data visualization.
Libraries such as pandas, SciPy, statsmodels, and Matplotlib can support research workflows.
R Statistical Analysis
R provides extensive capabilities for statistical modeling, hypothesis testing, visualization, and reproducible research.
It is especially useful for specialized statistical methods and complex analytical projects.
At Paperza, we help clients select appropriate tools based on their data and research requirements.
Our Research Data Analysis Process
We follow a structured workflow to help researchers obtain accurate and understandable results.
Step 1: Research Requirements Review
We review your research objectives, hypotheses, methodology, dataset, and expected deliverables.
Step 2: Dataset Assessment
We examine the data structure, variables, missing values, and suitability for the requested analysis.
Step 3: Statistical Method Selection
We identify appropriate statistical procedures based on the research design and available data.
Step 4: Data Cleaning and Preparation
We prepare the dataset and document relevant cleaning decisions.
Step 5: Statistical Analysis
We conduct the agreed analysis using SPSS, Excel, Python, or R.
Step 6: Results Interpretation
We explain the statistical outputs, including relevant effect estimates, significance tests, and limitations.
Step 7: Final Report and Delivery
We provide the agreed analysis files, tables, charts, and interpretation report.
How Much Do SPSS Data Analysis Services Cost?
The cost of statistical analysis depends on the dataset size, research complexity, number of statistical tests, and required reporting.
Paperza offers the following service packages.
| Package | Starting price | Service |
| Basic | $50 | Up to 500 data rows, descriptive statistics, 3 charts, brief interpretation |
| Standard | $150 | Up to 2,000 data rows, 3 statistical tests, 1 regression analysis, 6 charts |
| Premium | $350 | Up to 5,000 data rows, 6 statistical tests, up to 3 regression models, 10 charts |
All packages are subject to dataset suitability and agreed deliverables.
Complex statistical models, extensive data cleaning, specialized methodologies, and additional reporting may require a custom quotation.
Common Mistakes in SPSS Data Analysis
1. Choosing the Wrong Statistical Test
Different statistical tests require different types of data and assumptions.
Selecting an inappropriate test can produce misleading results.
2. Ignoring Missing Data
Missing values can affect estimates, statistical power, and interpretation.
Researchers should evaluate the extent and pattern of missingness before deciding how to handle it.
3. Failing to Check Statistical Assumptions
Many statistical procedures require assumptions concerning independence, distributions, or relationships between variables.
These assumptions should be evaluated where applicable.
4. Misinterpreting P-Values
A p-value does not indicate the probability that a research hypothesis is true.
Researchers should also consider effect sizes, confidence intervals, study design, and practical relevance.
5. Confusing Correlation With Causation
A statistical association between two variables does not automatically demonstrate that one causes the other.
6. Reporting Only Significant Results
Researchers should report relevant findings accurately, including nonsignificant results.
Statistical analyses should not be manipulated to produce predetermined conclusions.
7. Poor Presentation of Statistical Findings
Tables and charts should be clearly labeled, appropriately formatted, and consistent with the reported analysis.
Why Choose Paperza for SPSS Data Analysis Services?
Paperza provides statistical support designed around the needs of researchers, postgraduate students, and academic professionals.
Our services focus on:
- Appropriate statistical methods.
- Accurate data cleaning.
- Clear statistical reporting.
- Professional data visualization.
- SPSS, Excel, Python, and R support.
- Understandable results interpretation.
- Organized analysis files.
- Confidential handling of research data.
- Support tailored to research objectives.
We emphasize accurate analysis and transparent reporting rather than guaranteeing particular statistical outcomes.
For projects involving systematic reviews and quantitative evidence synthesis, explore Paperza's systematic review and meta-analysis support services.
Frequently Asked Questions About SPSS Data Analysis Services
Can I hire someone to help with SPSS data analysis?
Yes. Researchers can hire statistical professionals to assist with data cleaning, statistical tests, regression analysis, interpretation, and reporting, subject to applicable academic integrity requirements.
Can you analyze my master's thesis data using SPSS?
Yes. Paperza provides statistical assistance for master's research projects, including descriptive analysis, hypothesis testing, and interpretation.
Do you provide PhD dissertation data analysis services?
Yes. We support doctoral researchers with quantitative data analysis, statistical modeling, and reporting.
Can you analyze questionnaire data?
Yes. We can assist with coding questionnaire responses, descriptive statistics, reliability analysis, correlations, and other appropriate statistical procedures.
Can you perform regression analysis in SPSS?
Yes. Our services include linear and logistic regression analysis, model diagnostics, and interpretation, depending on the research requirements.
Can you provide SPSS output files?
Yes. SPSS output and data files can be included in the agreed deliverables.
Can you help interpret SPSS results?
Yes. We provide explanations of relevant statistical outputs, including test statistics, coefficients, confidence intervals, and p-values.
Do you offer Excel, Python, and R data analysis?
Yes. Paperza supports statistical analysis using SPSS, Excel, Python, and R.
How long does SPSS data analysis take?
Simple descriptive analysis may take a few working days. More complex datasets and statistical models may require additional time.
Do you guarantee statistically significant results?
No. Statistical findings depend on the actual data and research design. We do not fabricate, manipulate, or selectively report results to achieve a desired conclusion.
Get Professional SPSS Data Analysis Help for Your Research
Accurate statistical analysis is essential for producing reliable research findings.
Whether you are preparing a master's thesis, PhD dissertation, journal manuscript, or organizational research report, selecting appropriate statistical methods and interpreting the results correctly can make a significant difference in the quality of your work.
At Paperza, we provide SPSS data analysis services, Excel statistical analysis, Python and R data analysis, hypothesis testing, regression analysis, data visualization, and statistical interpretation.
Our services are designed to help researchers understand their datasets and present findings accurately.
Need professional SPSS data analysis services for your research project?
Visit Paperza.com to explore our statistical analysis services and get started.
Share your research topic, dataset, research questions, statistical requirements, and deadline to receive assistance tailored to your project.
I will analyze your research data using spss, excel, python, or r
SPSS, Excel, Python & R Statistical Data Analysis Need professional statistical data analysis for your research project, thesis, dissertation, or journal publication? I provide...
View Related Service >NEED PROFESSIONAL ASSISTANCE?
I will analyze your research data using spss, excel, python, or r
SPSS, Excel, Python & R Statistical Data Analysis Need professional statistical data analysis for your research project, thesis,...